Innovative Technology Map
We explore the innovative strategies of leading global companies through various technological fields, including industrial automation, AI-powered robots, service robots, and medical robots. Taiwan Technology Marketplace (TWTM) analyzes key industry leaders from the U.S. (Boston Dynamics, NVIDIA, Google), Europe (ABB, KUKA), Japan (FANUC, Yaskawa), and South Korea (Samsung, LG). By examining key data such as the number of patent applications, technology classifications, co-ownership relationships, and citation links, we can predict the development trends of robotics technology and identify potential market opportunities. This analysis of patent data serves as a key, unlocking the door for enterprises to explore robotics innovation and industry collaboration ecosystems.
Patent Insight Report
This report provides an analysis of patent trends and insights in the field of robotics over the past five years. It covers key aspects such as patent applications, approvals, technology life cycles, major innovations, and geographic distribution. The study also examines leading patent holders, inventors, and high-impact patents, including those with the highest citation counts. Additionally, it explores market-valued patents, licensing agreements, and patent litigation trends. To offer a comprehensive overview, the report utilizes tools such as innovation word clouds and technology landscape maps to visualize the current state of the industry.
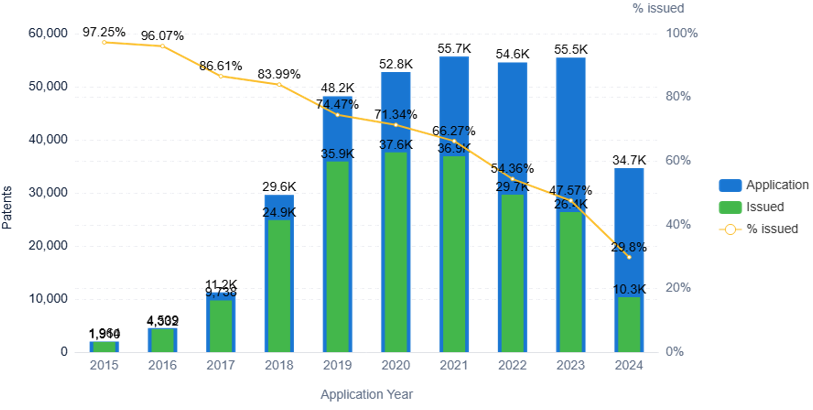
Application and Issued Trend |
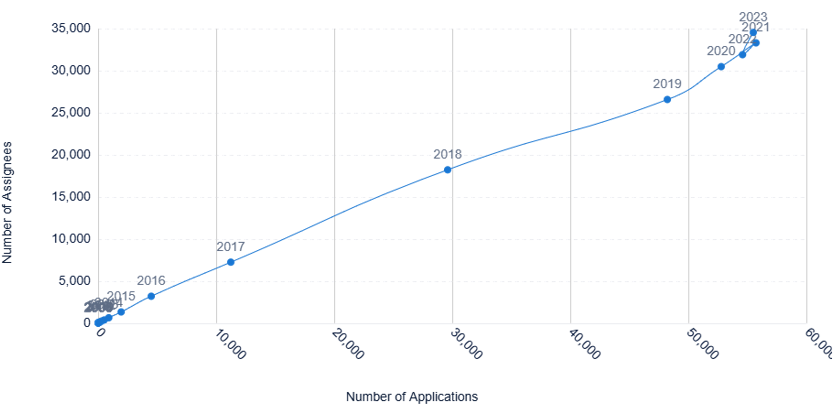
Technology Life Cycle |
| Analyze the annual application trend of the technology. This chart shows the number of grants or issued patents resulting from applications filed in the same year. This is helpful for understanding the rate of applications over a period of time, whether the technology is recent, or whether it is heading towards stagnancy. The grant rate is useful to understand the date from which the technology protection is established and the rate of successful applications over a period of time. Blue represents the application trend and green represents the trend of issued patents resulting from applications of the same year. Example: if a 2012 patent application is issued in 2014, the issued patents will appear in 2012 in green. | Analyze the change in number of applications and patent applicants over time to understand the life cycle of the technology space. This graph may indicate at what stage the technology is in as well as its history. Whether it is wise or suitable to invest, or if the technology is in a state of decline. |
 |
 |
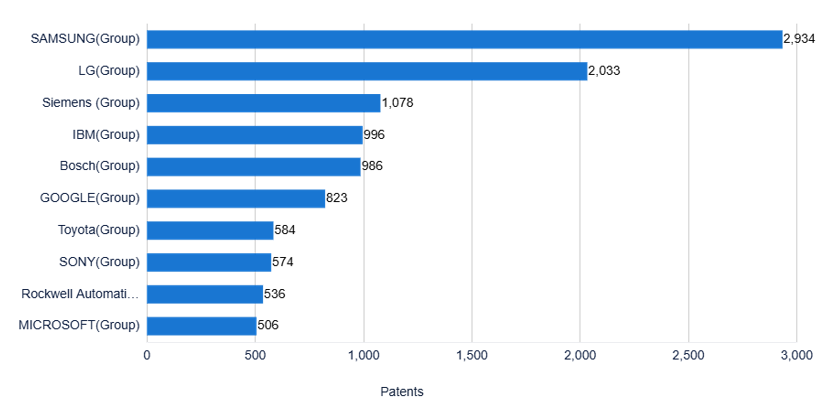
Top Assignees |
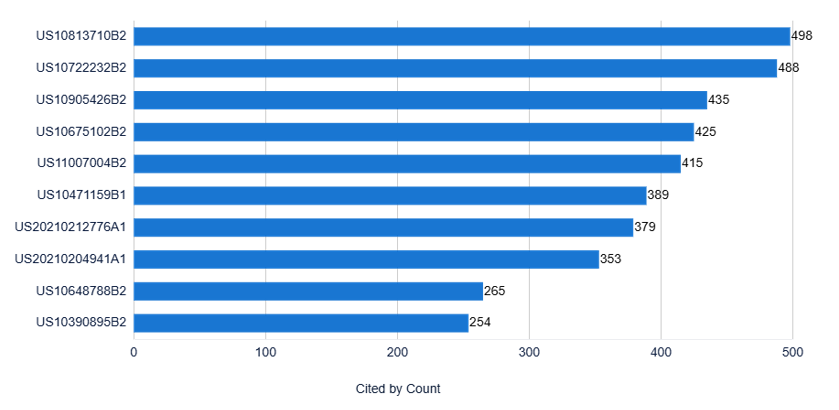
Most Cited Patents |
| The top companies with the largest patent portfolios in the technology field. Understand who are the largest players and the competitive threats in the technology space. | View the top 10 records that have been cited most frequently by other records to understand which records are more prolific and have had their technology built upon by others. These patents are likely to be more influential and may represent the core, innovative technology of the organization it represents. |
 |
 |
See the full report. | |
With the advancement of artificial intelligence, machine learning, and human-machine interaction technologies, the robotics field is undergoing significant transformation. Exoskeletons and assistive mobility technologies improve physical functions, while smart logistics and industrial automation enhance production efficiency. Smart agriculture and environmental applications promote sustainable development. Healthcare and medical technologies, powered by AI and big data, are changing diagnostic methods and improving service quality and efficiency. The integration of these technologies not only enhances quality of life but also creates more opportunities and challenges for future societies.