Innovative Technology Map
We explore the evolving landscape of drone technologies, spanning drone manufacturing, autonomous flight systems, sensor modules, and AI-powered cloud platforms. Our research focuses on the innovation strategies of leading companies such as SZ DJI, Yuneec, 3D Robotics, Skydio, Parrot Drones, Autel Robotics, and AeroVironment.Through in-depth analysis of patent data—including application volumes, technology classifications, co-ownership, and citation networks—we uncover key trends shaping the future of drones and identify emerging opportunities in defense, logistics, agriculture, and urban inspection. These insights serve as a gateway for businesses to engage in the growing ecosystem of smart aviation and low-altitude innovation.
Patent Insight Report
This report analyzes the patent trends and insights in the field of drone technology over the past five years, covering patent application and grant trends, as well as the technology lifecycle, key technologies, and geographical distribution. It delves into major patent holders, inventors, and key patents, such as the most frequently cited patents. Furthermore, it analyzes market valuation patents, licensing agreements, and information related to patent litigation. Finally, it uses tools such as innovation word clouds and technology landscape maps to present an overview of the technological field.
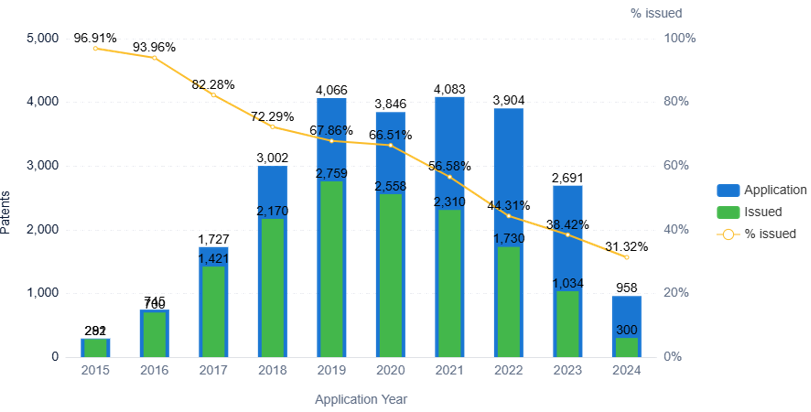
Application and Issued Trend |
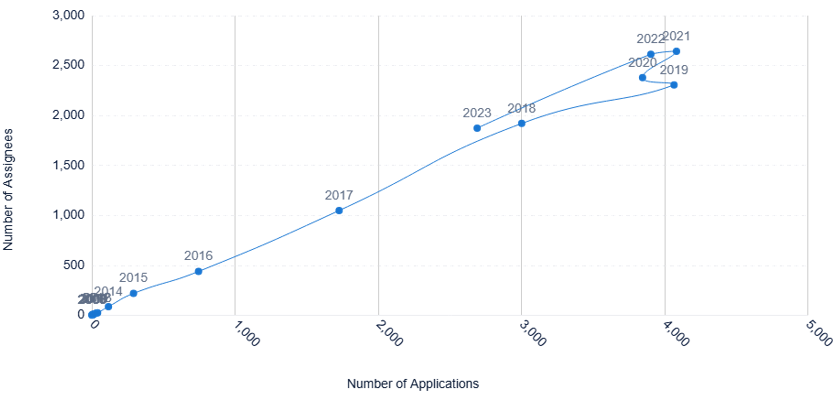
Technology Life Cycle |
| Analyze the annual application trend of the technology. This chart shows the number of grants or issued patents resulting from applications filed in the same year. This is helpful for understanding the rate of applications over a period of time, whether the technology is recent, or whether it is heading towards stagnancy. The grant rate is useful to understand the date from which the technology protection is established and the rate of successful applications over a period of time. Blue represents the application trend and green represents the trend of issued patents resulting from applications of the same year. Example: if a 2012 patent application is issued in 2014, the issued patents will appear in 2012 in green. | Analyze the change in number of applications and patent applicants over time to understand the life cycle of the technology space. This graph may indicate at what stage the technology is in as well as its history. Whether it is wise or suitable to invest, or if the technology is in a state of decline. |
 |
 |
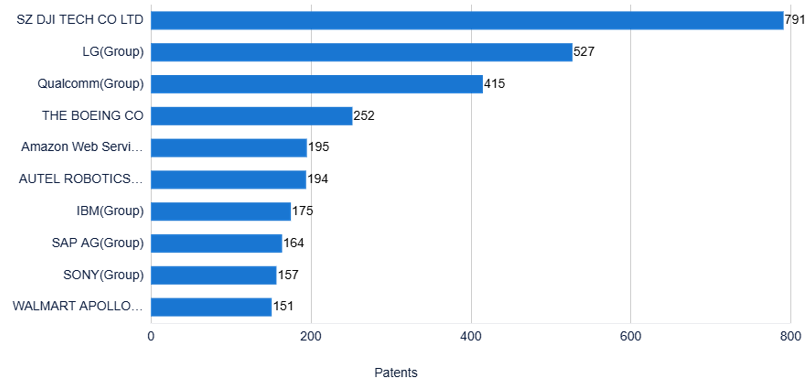
Top Assignees |
Most Cited Patents |
| The top companies with the largest patent portfolios in the technology field. Understand who are the largest players and the competitive threats in the technology space. | View the top 10 records that have been cited most frequently by other records to understand which records are more prolific and have had their technology built upon by others. These patents are likely to be more influential and may represent the core, innovative technology of the organization it represents. |
 |
 |
See the full report. | |
As drone applications continue to diversify—from aerial imaging and infrastructure inspection to disaster response—the core technologies behind them are rapidly evolving. Today’s drones are no longer just flying machines; they integrate intelligent decision-making, responsive sensing, and efficient platform architectures to become capable aerial partners in mission execution. Driving this transformation is a range of key technologies, including autonomous navigation, communication integration, and modular system design. These advancements enable drones to operate with greater stability, intelligence, and adaptability across various scenarios. Stay ahead of the curve by exploring the latest trends in drone technology and uncovering the core forces shaping the future of aerial applications.