技術關聯圖
國際指標廠商
專利洞察報告
亮點技術
技術發表影片

《切換頁籤查看不同內容》
我們透過多元技術領域,包括工業自動化、人工智慧機器人、服務型機器人及醫療機器人等,深入探索全球領先企業的創新策略。臺灣技術交易資訊網(TWTM)分析來自美國(Boston Dynamics、NVIDIA、Google)、歐洲(ABB、KUKA)、日本(FANUC、Yaskawa)、韓國(Samsung、LG)等關鍵指標廠商。 藉由剖析專利申請數量、技術分類、專利共有人關係及技術引證鏈結等關鍵數據,我們能夠預測機器人技術的發展趨勢,並勾勒出潛在的市場機會。這些專利數據的分析,如同一把鑰匙,開啟企業探索機器人科技創新及產業合作生態系的大門。
專利洞察報告
本報告分析了過去五年機器人技術領域的專利趨勢與洞察,範圍涵蓋專利申請、核准趨勢,以及技術生命週期、主要技術和地理分布。深入探討了主要專利權人、發明人以及關鍵專利,例如引用次數最多的專利。此外,也分析了市場估值專利、授權協議,以及專利訴訟相關資訊。最後,使用創新詞雲和技術景觀圖等工具,呈現技術領域的概況。
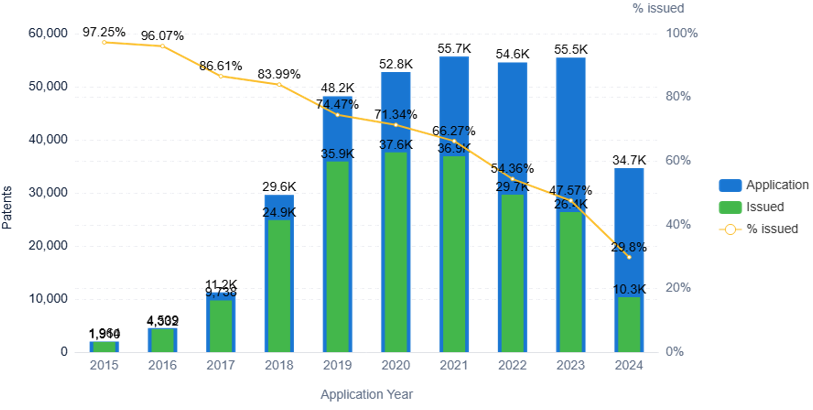
Application and Issued Trend |
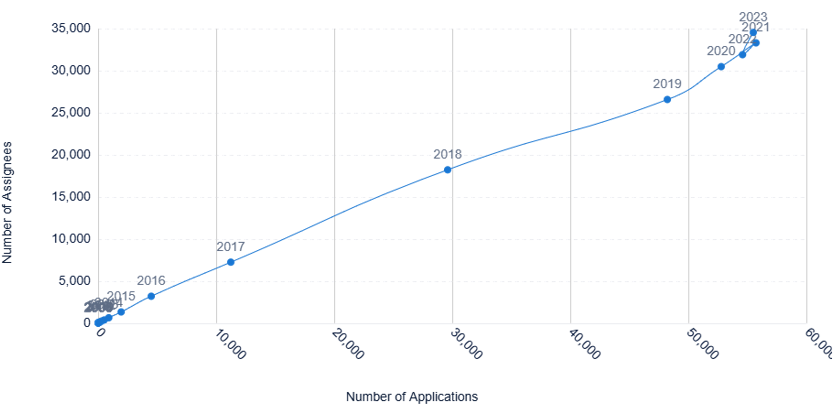
Technology Life Cycle |
| Analyze the annual application trend of the technology. This chart shows the number of grants or issued patents resulting from applications filed in the same year. This is helpful for understanding the rate of applications over a period of time, whether the technology is recent, or whether it is heading towards stagnancy. The grant rate is useful to understand the date from which the technology protection is established and the rate of successful applications over a period of time. Blue represents the application trend and green represents the trend of issued patents resulting from applications of the same year. Example: if a 2012 patent application is issued in 2014, the issued patents will appear in 2012 in green. | Analyze the change in number of applications and patent applicants over time to understand the life cycle of the technology space. This graph may indicate at what stage the technology is in as well as its history. Whether it is wise or suitable to invest, or if the technology is in a state of decline. |
 |
 |
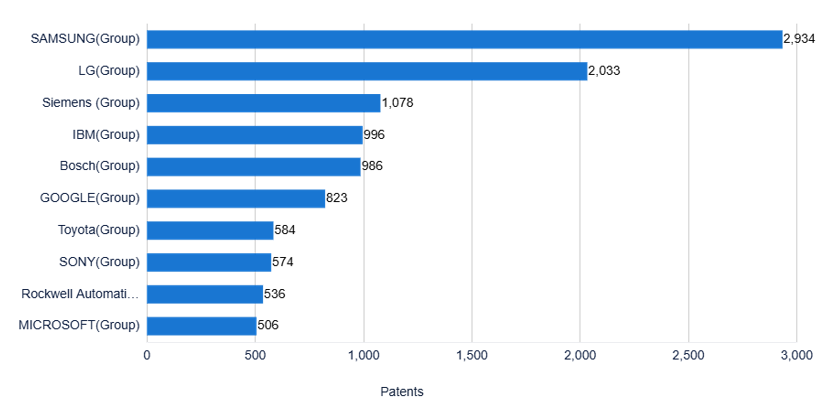
Top Assignees |
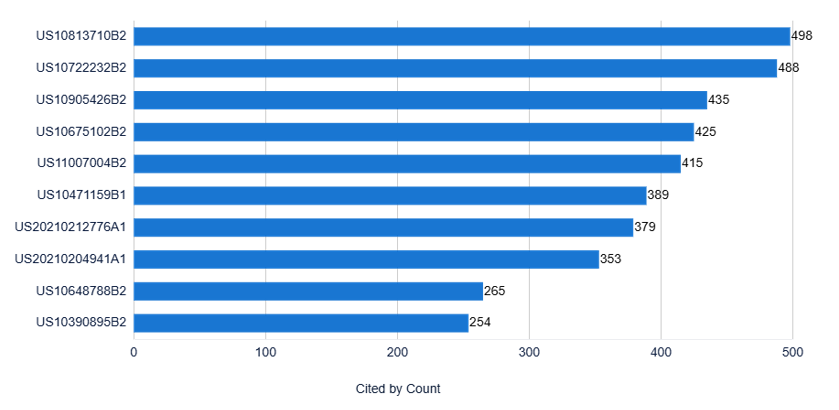
Most Cited Patents |
| The top companies with the largest patent portfolios in the technology field. Understand who are the largest players and the competitive threats in the technology space. | View the top 10 records that have been cited most frequently by other records to understand which records are more prolific and have had their technology built upon by others. These patents are likely to be more influential and may represent the core, innovative technology of the organization it represents. |
 |
 |
了解全面解析,查看完整報告 | |
隨著人工智慧、機器學習和人機互動技術的進步,機器人領域正在經歷顯著變革。外骨骼與行動輔助技術改善了身體功能,智慧物流與工業自動化提升了生產效率,智慧農業與環境應用則推動可持續發展。醫療與健康科技透過AI與大數據改變診療模式,提升服務品質與效率。這些技術的融合不僅改善了生活品質,也為未來的社會創造更多機會與挑戰。
10場精彩的機器人技術發表影片,快來觀看吧!
謝謝您的建議! 您的回饋是我們進步的動力!